

Online fashion resale marketplace ThredUp (NASDAQ:TDUP) reported revenue ahead of Wall Street’s expectations in Q1 CY2025, with sales up 10.5% year on year to $71.29 million. On top of that, next quarter’s revenue guidance ($73.5 million at the midpoint) was surprisingly good and 3.7% above what analysts were expecting. Its GAAP loss of $0.04 per share was 42.9% above analysts’ consensus estimates.
Is now the time to buy ThredUp? Find out by accessing our full research report, it’s free.
ThredUp (TDUP) Q1 CY2025 Highlights:
- Revenue: $71.29 million vs analyst estimates of $68.32 million (10.5% year-on-year growth, 4.4% beat)
- EPS (GAAP): -$0.04 vs analyst estimates of -$0.07 (42.9% beat)
- Adjusted EBITDA: $3.81 million vs analyst estimates of $2.17 million (5.3% margin, 75.1% beat)
- The company lifted its revenue guidance for the full year to $286 million at the midpoint from $275 million, a 4% increase
- Operating Margin: -7.6%, up from -19.2% in the same quarter last year
- Free Cash Flow Margin: 5.5%, up from 3.4% in the same quarter last year
- Orders: 1.37 million, up 189,000 year on year
- Market Capitalization: $520.6 million
“We are proud to deliver Q1 out-performance, including a record quarter for new buyer acquisition,” said ThredUp CEO and co-founder James Reinhart.
Company Overview
Founded to revolutionize thrifting, ThredUp (NASDAQ:TDUP) is a leading online fashion resale marketplace offering a wide selection of gently-used clothing and accessories.
Sales Growth
A company’s long-term performance is an indicator of its overall quality. Even a bad business can shine for one or two quarters, but a top-tier one grows for years. Unfortunately, ThredUp’s 8.3% annualized revenue growth over the last five years was sluggish. This fell short of our benchmark for the consumer discretionary sector and is a poor baseline for our analysis.
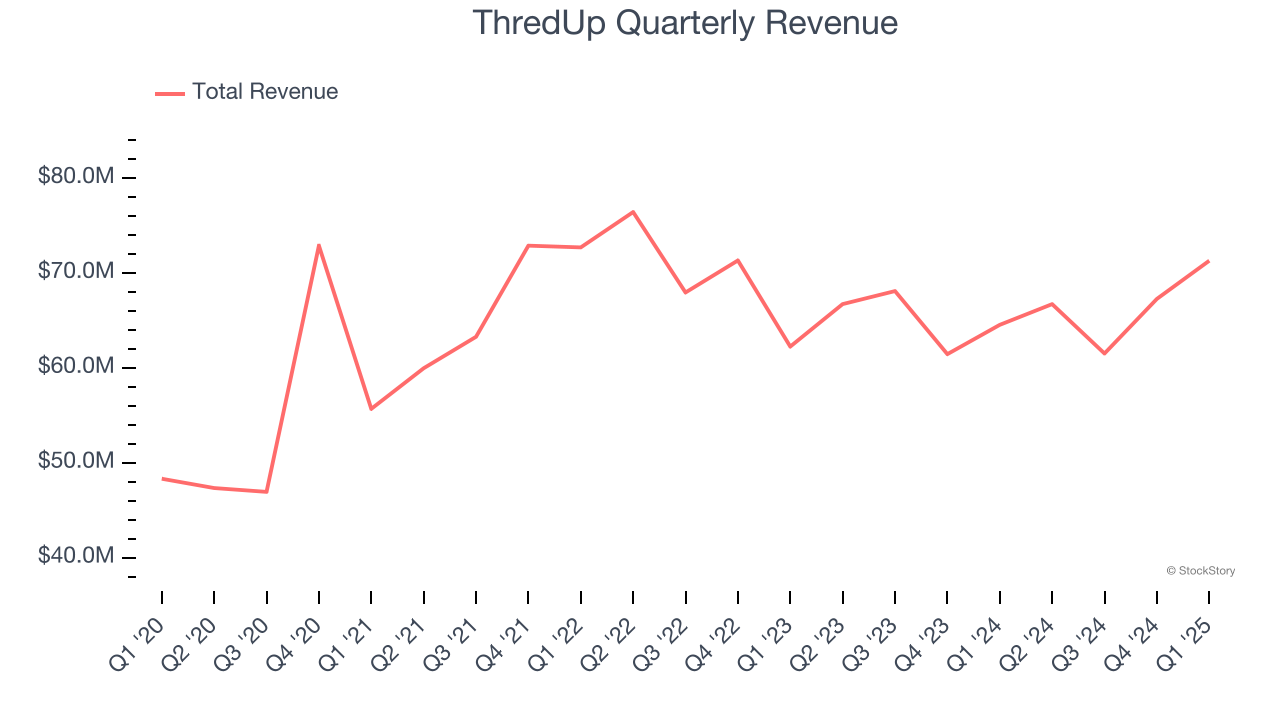
Long-term growth is the most important, but within consumer discretionary, product cycles are short and revenue can be hit-driven due to rapidly changing trends and consumer preferences. ThredUp’s performance shows it grew in the past but relinquished its gains over the last two years, as its revenue fell by 2% annually. 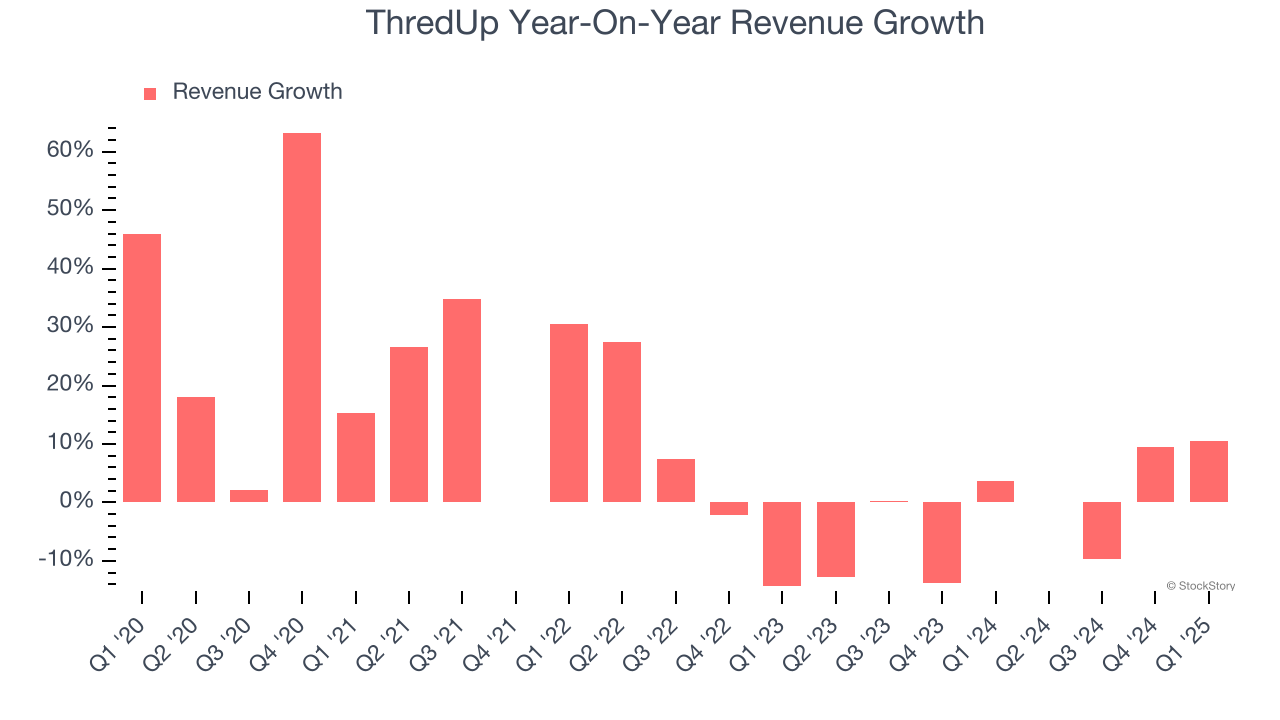
ThredUp also discloses its number of orders, which reached 1.37 million in the latest quarter. Over the last two years, ThredUp’s orders averaged 6.5% year-on-year declines. Because this number is lower than its revenue growth during the same period, we can see the company’s monetization has risen. 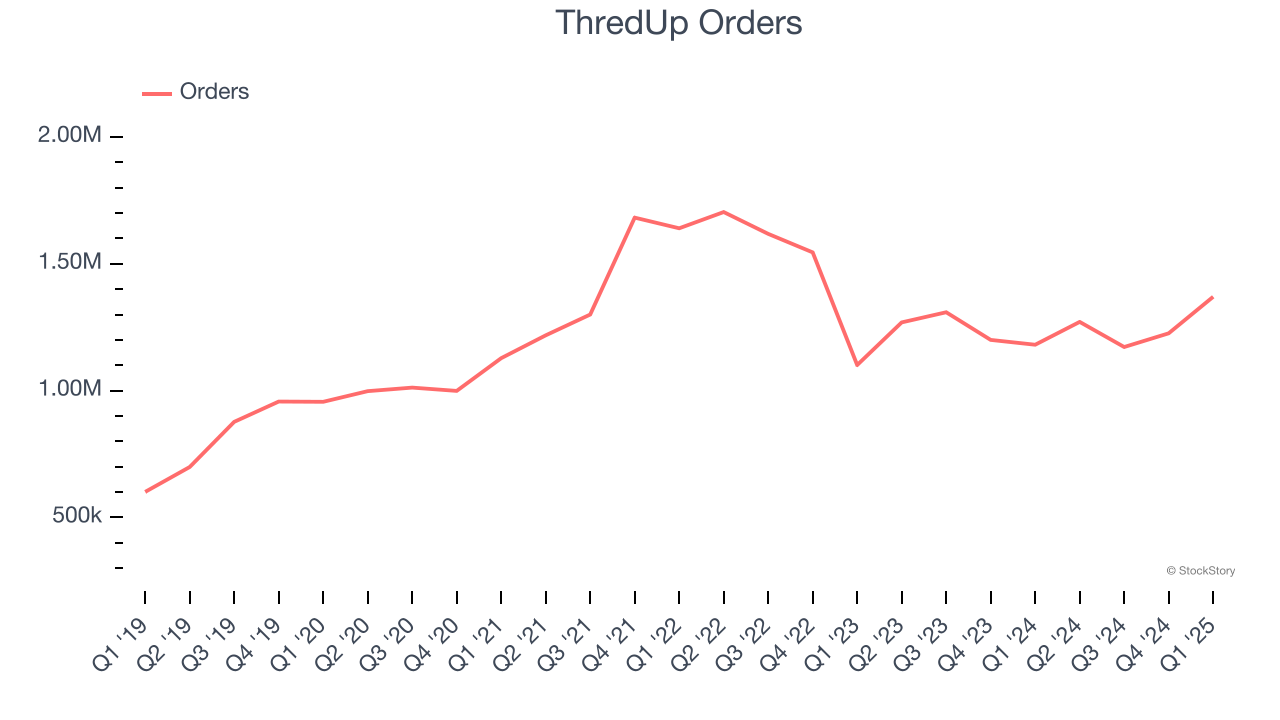
This quarter, ThredUp reported year-on-year revenue growth of 10.5%, and its $71.29 million of revenue exceeded Wall Street’s estimates by 4.4%. Company management is currently guiding for a 10.2% year-on-year increase in sales next quarter.
Looking further ahead, sell-side analysts expect revenue to grow 5.2% over the next 12 months. While this projection implies its newer products and services will spur better top-line performance, it is still below average for the sector.
Today’s young investors won’t have read the timeless lessons in Gorilla Game: Picking Winners In High Technology because it was written more than 20 years ago when Microsoft and Apple were first establishing their supremacy. But if we apply the same principles, then enterprise software stocks leveraging their own generative AI capabilities may well be the Gorillas of the future. So, in that spirit, we are excited to present our Special Free Report on a profitable, fast-growing enterprise software stock that is already riding the automation wave and looking to catch the generative AI next.
Operating Margin
Operating margin is a key measure of profitability. Think of it as net income - the bottom line - excluding the impact of taxes and interest on debt, which are less connected to business fundamentals.
ThredUp’s operating margin has been trending up over the last 12 months, but it still averaged negative 15.6% over the last two years. This is due to its large expense base and inefficient cost structure.
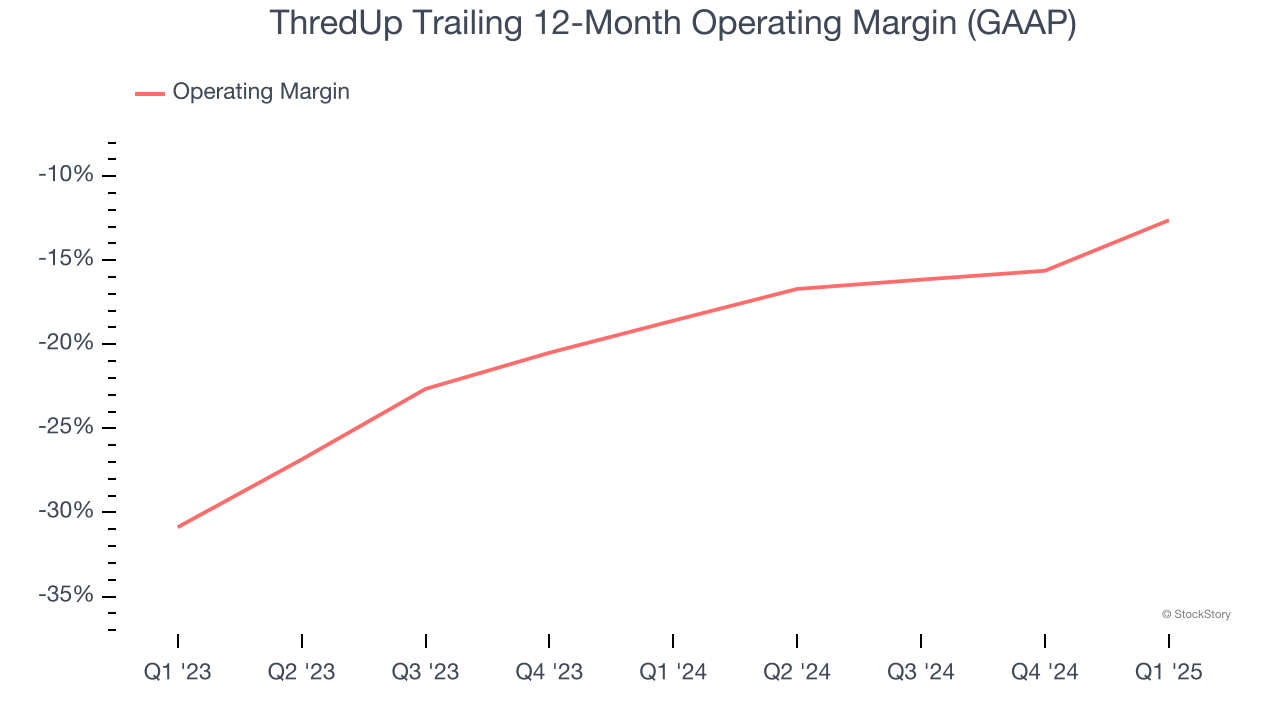
This quarter, ThredUp generated a negative 7.6% operating margin. The company's consistent lack of profits raise a flag.
Earnings Per Share
Revenue trends explain a company’s historical growth, but the long-term change in earnings per share (EPS) points to the profitability of that growth – for example, a company could inflate its sales through excessive spending on advertising and promotions.
Although ThredUp’s full-year earnings are still negative, it reduced its losses and improved its EPS by 32.3% annually over the last five years. The next few quarters will be critical for assessing its long-term profitability.
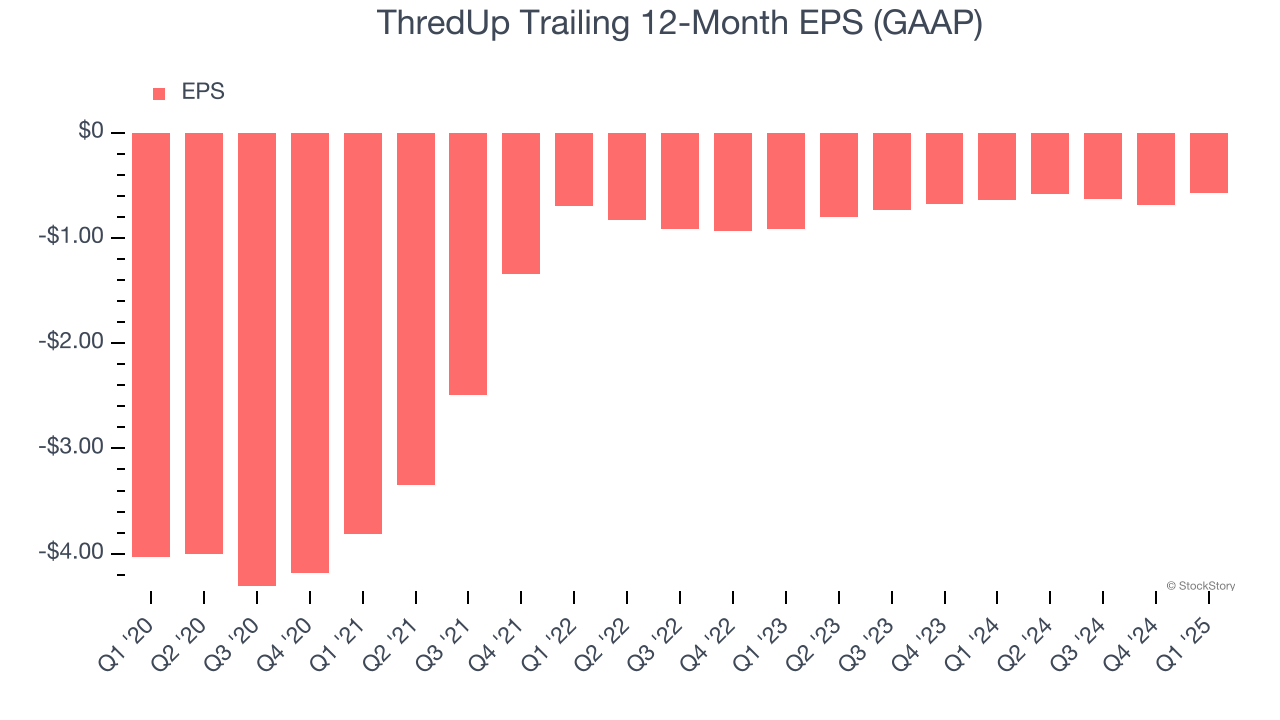
In Q1, ThredUp reported EPS at negative $0.04, up from negative $0.15 in the same quarter last year. This print easily cleared analysts’ estimates, and shareholders should be content with the results. We also like to analyze expected EPS growth based on Wall Street analysts’ consensus projections, but there is insufficient data.
Key Takeaways from ThredUp’s Q1 Results
We were impressed by ThredUp’s optimistic full-year revenue guidance, which blew past analysts’ expectations. We were also excited its EBITDA outperformed Wall Street’s estimates by a wide margin. On the other hand, its number of orders missed. Zooming out, we think this was a good print with some key areas of upside. The stock traded up 7.9% to $4.78 immediately following the results.
ThredUp put up rock-solid earnings, but one quarter doesn’t necessarily make the stock a buy. Let’s see if this is a good investment. We think that the latest quarter is only one piece of the longer-term business quality puzzle. Quality, when combined with valuation, can help determine if the stock is a buy. We cover that in our actionable full research report which you can read here, it’s free.