
VANCOUVER, British Columbia, May 07, 2025 (GLOBE NEWSWIRE) -- Calibre Mining Corp. (TSX: CXB; OTCQX: CXBMF) (the "Company" or "Calibre") is pleased to announce financial and operating results for the three months (“Q1”) ended March 31, 2025, and an update on the Valentine Gold Mine (“Valentine”), located in Newfoundland & Labrador, Canada. Consolidated Q1 2025 filings can be found at www.sedarplus.ca and on the Company’s website at www.calibremining.com. All figures are expressed in U.S. dollars unless otherwise stated.
Darren Hall, President and Chief Executive Officer of Calibre, stated: “I am proud of the teams operational performance across the portfolio, responsibly delivering 71,539 ounces in Q1, positioning the Company to meet, and potentially exceed, full-year production guidance of 230,000 – 280,000 ounces. I am also pleased with our continued focus on cost discipline, with the Company’s consolidated all-in sustaining costs coming in below budget at $1,389/oz for the quarter.
At Valentine, construction continues to advance with first gold now expected by the end of Q3. The delay was due to lower than planned productivity, and minor scope growth, which has resulted in an $80 million (C$110 million) increase to the initial project capital since our October 2024 update of C$744 million. Approximately 75% of the capital increase is attributable to the schedule extension and 25% is related to scope growth and quantity. As at the end of April the initial project capital remains fully funded with $203 million (C$280 million) in cash and $73 million (C$101 million) remaining to be incurred.
With mass construction materially complete the focus is on final electrical, piping, and instrumentation activities within the process plant. The primary crusher has been commissioned, with the coarse ore stockpile building well underway and ready to receive material by the end of May.
To ensure smooth commissioning and transition to operations, we have strengthened contractor oversight and enhanced the owner’s team with the recent appointment of Pierre Légaré as Project Director for the process plant. Pierre is the Managing Director of Alvarez and Marsal INFRA Canada and has a proven track record over 30 years of project development across the mining and construction industries. His extensive career also includes over 20 years in senior roles at SNC-Lavalin, culminating in his position as Vice-President of Projects in the Mining & Metallurgy division. These actions position us for a safe, more controlled, and efficient ramp-up, with operations expected to reach nameplate capacity in Q1 2026.
We have successfully completed Valentine mine and mill staffing in preparation for commissioning and ramp-up activities. Importantly, key roles have commissioning experience which is critical to a smooth ramp up and long-term operational performance.
As a long-life, low-cost cornerstone asset in Canada, Valentine is expected to produce approximately 200,000 ounces of gold annually. The asset also offers significant exploration upside, highlighted by our new discovery where drilling intercepted 172.8 metres grading 2.43 g/t gold. 2025 will mark the largest pure exploration program in the property’s history.
We greatly appreciate the support of our shareholders for approving the merger with Equinox Gold, which is expected to close by the end of Q2. Through enhanced scale, a diversified asset base, and new high quality Canadian production, this merger is positioned to deliver greater value than either company could achieve independently.”
Q1 2025 Highlights
- Consolidated gold production of 71,539 ounces; Nicaragua 64,469 ounces and Nevada 7,070 ounces;
- The multi-million-ounce Valentine Gold Mine is set to achieve production in Q3;
- The largest pure exploration drill program is underway at Valentine totalling 100,000 metres; recent Frank Zone discovery drilling highlights (see Calibre news releases dated November 25, 2024, and February 11, 2025), southwest of the Leprechaun pit includes:
- 2.43 g/t Au over 172.8 metres ETW including 3.84 g/t Au over 90.9 metres ETW in Hole FZ-24-048; and
- 2.12 g/t Au over 95.4 metres ETW in Hole FZ-24-046, 2.26 g/t Au over 78.3 metres ETW in Hole FZ-24-040, 3.08 g/t Au over 48.2 metres ETW in Hole FZ-24-062.
Equinox Gold and Calibre Combine to Create a Major Americas-Focused Gold Producer
- Announced the merger of Calibre and Equinox Gold to create a major Americas-focused gold producer with enhanced diversification, scale, financial strength, and operational expertise. The combined company will deliver long-term value to all stakeholders. Key highlights include:
- Strengthened combined leadership team with a proven track record of value creation;
- Immediate increase in production and substantial cash flow from a larger asset portfolio;
- Creation of the second largest gold producer in Canada;
- Significant re-rate potential based on valuation of peers;
- A major diversified gold producer in the Americas;
- Exceptional growth profile with a pipeline of development and expansion projects; and
- Strong balance sheet with ability to rapidly deleverage and return capital to shareholders.
Gold Sales and Cost Metrics
- Consolidated gold sales of 71,545 ounces, generating $200.0 million in gold revenue (Q1 2024 - $129.2 million), at an average realized gold price of $2,796/oz; Nicaragua 64,469 ounces and Nevada 7,076 ounces;
- Consolidated Total Cash Cost1 (“TCC”) of $1,221/oz; Nicaragua $1,173/oz and Nevada $1,654/oz;
- Consolidated All-In Sustaining Cost1 (“AISC”) of $1,389/oz; Nicaragua $1,255/oz and Nevada $1,748/oz; and
- Cash and restricted cash of $177.4 million and $36.6 million, respectively, as at March 31, 2025, with the final $25.0 million of restricted cash released to the Company in April 2025.
Valentine Update
- Tailings Management Facility is complete;
- Structural steel is complete;
- Mass construction nearing completion; project has transitioned to system/sub-system completion;
- Primary crusher installation and commissioning complete;
- Mills motors and mill liners are installed, and pre-commissioning is underway;
- Conveyors are complete and commissioned;
- CIL tanks piping and electrical continue, and pre-commissioning to follow;
- Coarse ore stockpile building, reclaim tunnel, and apron feeder construction nearly complete and progressing toward pre-commissioning;
- ADR plant and gravity circuit mechanically complete and have been turned over to pre-commissioning;
- Cable tray, cable installation, and terminations progressing;
- Commencement of ore processing expected during Q3, reflecting minor scope growth in certain areas such as electrical cabling and current contractor performance;
- Updated initial project capital cost is now estimated at approximately C$854 million (excluding sunk costs). At April 30, 2025, initial project capital costs on an incurred basis totalled C$753 million (excluding sunk costs);
- Initial project capital cost is fully funded with over $203 million (C$280 million) in cash at April 30, 2025; and
- Phase 2 technical studies progressing, targeting an increase in the plant throughput from 2.5 Mtpa to >5 Mtpa.
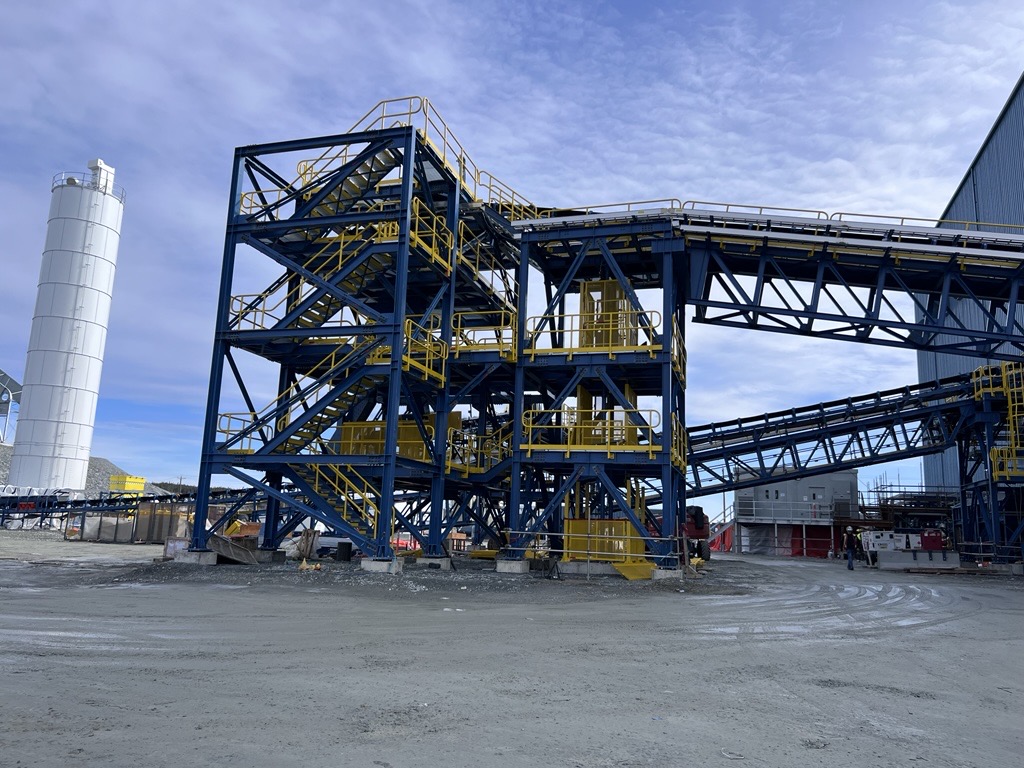
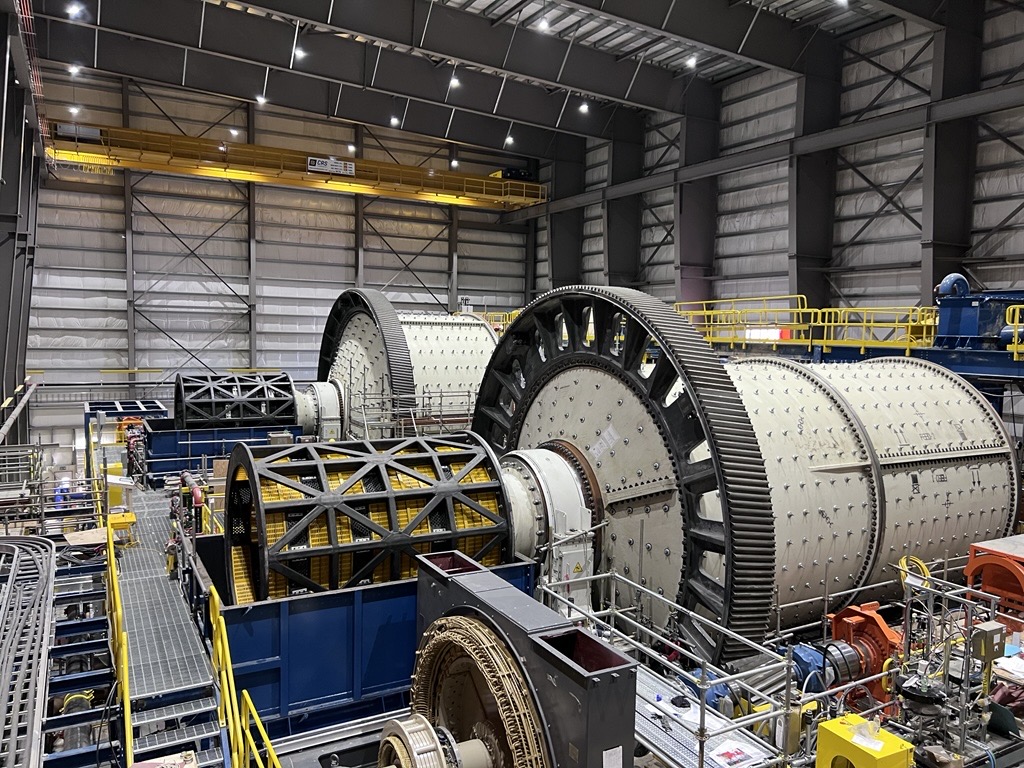
Valentine Construction Progress Photos
Pebble Crusher and Recirculating Conveyors – April 2025
SAG and Ball Mill - April 2025
CONSOLIDATED RESULTS Q1 2025
Consolidated Results (1)
$'000 (except per share and per ounce amounts) | Three Months Ended | ||||||||
| Q1 2025 | Q4 2024 | Q1 2024 | |||||||
| Revenue | $ | 202,622 | $ | 202,966 | $ | 131,888 | |||
| Cost of sales, including depreciation and amortization | $ | (123,322 | ) | $ | (138,607 | ) | $ | (102,631 | ) |
| Earnings from mine operations | $ | 79,300 | $ | 64,359 | $ | 29,257 | |||
| EBITDA(2) | $ | 83,226 | $ | 73,456 | $ | 26,479 | |||
| Adjusted EBITDA(2) | $ | 100,764 | $ | 95,573 | $ | 37,320 | |||
| Net earnings | $ | 22,599 | $ | 16,661 | $ | (3,636 | ) | ||
| Adjusted net earnings(2) | $ | 40,137 | $ | 38,550 | $ | 5,587 | |||
| Operating cash flows before working capital(2) | $ | 55,074 | $ | 127,587 | $ | 62,862 | |||
| Operating cash flow | $ | 53,476 | $ | 91,404 | $ | 45,815 | |||
| Capital expenditures (sustaining)(2) | $ | 4,605 | $ | 6,940 | $ | 7,708 | |||
| Capital expenditures (growth)(2) | $ | 121,206 | $ | 125,485 | $ | 68,149 | |||
| Capital expenditures (exploration) | $ | 13,494 | $ | 13,985 | $ | 7,707 | |||
| Operating Results | |||||||||
| Gold ounces produced | 71,539 | 76,269 | 61,767 | ||||||
| Gold ounces sold | 71,545 | 76,252 | 61,778 | ||||||
| Per Ounce Data | |||||||||
| Average realized gold price(2) ($/oz) | $ | 2,796 | $ | 2,616 | $ | 2,092 | |||
| TCC ($/oz) (2) | $ | 1,221 | $ | 1,243 | $ | 1,337 | |||
| AISC ($/oz) (2) | $ | 1,389 | $ | 1,423 | $ | 1,555 | |||
| Weighted Avg. Numbers of Shares Outstanding | |||||||||
| Basic (in thousands) | 848,747 | 838,038 | 653,855 | ||||||
| Diluted (in thousands) | 905,293 | 869,947 | 681,420 | ||||||
| Per Share Data | |||||||||
| Earnings per share – basic | $ | 0.03 | $ | 0.02 | $ | (0.01 | ) | ||
| Earnings per share – fully diluted | $ | 0.02 | $ | 0.02 | $ | (0.01 | ) | ||
| Adjusted net earnings per share – basic(2) | $ | 0.05 | $ | 0.05 | $ | 0.01 | |||
| Operating cash flows before working capital/share(2) | $ | 0.06 | $ | 0.15 | $ | 0.10 | |||
| Operating cash flow per share | $ | 0.06 | $ | 0.11 | $ | 0.07 | |||
| Balance Sheet Data (in thousands, except for ratio) | |||||||||
| Cash and cash equivalents | $ | 177,385 | $ | 131,093 | $ | 54,385 | |||
| Adjusted net debt(2) | $ | 164,670 | $ | 165,201 | $ | 241,454 | |||
| Adj. Net debt/Adj. EBITDA (LTM) ratio(2, 3) | $ | 0.63 | $ | 0.77 | $ | 1.07 | |||
- Consolidated financial and operational results for Q1 2024 include the results from Marathon since its acquisition from the period of January 25, 2024, to March 31, 2024.
- This is a non-IFRS measure, for further information refer to the Non-IFRS Measures section in the Notes below.
- LTM is defined as the last twelve months.
Operating Results
| Three Months Ended | |||
| NICARAGUA | Q1 2025 | Q4 2024 | Q1 2024 |
| Ore mined (t) | 522,710 | 796,789 | 534,788 |
| Ore milled (t) | 585,576 | 617,415 | 531,011 |
| Grade (g/t Au) | 4.14 | 3.97 | 3.32 |
| Recovery (%) | 90.6 | 89.1 | 91.6 |
| Gold produced (ounces) | 64,469 | 66,578 | 55,007 |
| Gold sold (ounces) | 64,469 | 66,578 | 55,007 |
| Three Months Ended | |||
| NEVADA | Q1 2025 | Q4 2024 | Q1 2024 |
| Ore mined (t) | 1,174,281 | 1,116,192 | 988,694 |
| Ore placed on leach pad (t) | 1,162,180 | 1,136,772 | 975,354 |
| Grade (g/t Au) | 0.31 | 0.36 | 0.37 |
| Gold produced (ounces) | 7,070 | 9,691 | 6,760 |
| Gold sold (ounces) | 7,076 | 9,674 | 6,771 |
2025 GUIDANCE
| Q1 ACTUALS | CONSOLIDATED | NICARAGUA | NEWFOUNDLAND | NEVADA | ||
| Gold Production/Sales (ounces) | 71,539 | 230,000 - 280,000 | 200,000 - 250,000 | N/A | 30,000 - 40,000 | |
| TCC ($/ounce)1 | $1,221 | $1,300 - $1,400 | $1,200 - $1,300 | N/A | $1,600 - $1,700 | |
| AISC ($/ounce)1 | $1,389 | $1,500 - $1,600 | $1,400 - $1,500 | N/A | $1,600 - $1,700 | |
| Growth Capital ($ million) | $19 | $70 - $80 | $60 - $70 | N/A | $5 - $10 | |
| Exploration ($ million) | $13 | $50 - $60 | $25 - $30 | $15 - $20 | $5 - $10 | |
The 2025 guidance currently covers gold production, TCC, AISC, and growth capital for operations in Nicaragua and Nevada. The consolidated exploration guidance includes drilling activities at the Valentine gold mine. Guidance for Valentine, including production, TCC, AISC, growth and full-year consolidated details, will be provided after first gold is produced from Valentine, expected in Q3 of this year.
Calibre continues to reinvest in exploration and growth, with approximately 200,000 metres of diamond, RC and RAB drilling and the development of new satellite deposits across its entire asset portfolio. Growth capital investments include underground and open pit mine development, waste stripping and strategic land acquisitions.
| Q1 2025 Conference Call Details | ||
| Date: | Thursday, May 8, 2025 | |
| Time: | 10:00 am ET | |
| Webcast link: | https://edge.media-server.com/mmc/p/owjabixj | |
Instructions for obtaining conference call dial-in number:
- All parties must register at the link below to participate in Calibre’s Q1 2025 Conference Call.
- To register click https://dpregister.com/sreg/10197889/febb10ad93 and complete the online registration form.
- Once registered, registered participants will receive the dial-in numbers and PIN number for input at the time of the call.
The live webcast and registration link can also be accessed at www.calibremining.com under the Events section under the Investors tab. The live audio webcast will be archived and available for replay for 12 months after the event at www.calibremining.com. Presentation slides that will accompany the conference call will be made available in the Investors section of the Calibre website under Presentations prior to the conference call.
Qualified Person
The scientific and technical information contained in this news release was approved by David Schonfeldt P.GEO, Calibre’s Corporate Chief Geologist and a "Qualified Person" under National Instrument 43-101.
About Calibre
Calibre (TSX: CXB) is a Canadian-listed, Americas focused, growing mid-tier gold producer with a strong pipeline of development and exploration opportunities across Newfoundland & Labrador in Canada, Nevada and Washington in the USA, and Nicaragua. Calibre is focused on delivering sustainable value for Securityholders, local communities and all stakeholders through responsible operations and a disciplined approach to growth. With a strong balance sheet, a proven management team, strong operating cash flow, accretive development projects and district-scale exploration opportunities Calibre will unlock significant value.
ON BEHALF OF THE BOARD
“Darren Hall”
Darren Hall, President & Chief Executive Officer
For further information, please contact:
Ryan King
SVP Corporate Development & IR
T: 604.628.1012
E: calibre@calibremining.com
W: www.calibremining.com
Calibre’s head office is located at Suite 1560, 200 Burrard St., Vancouver, British Columbia, V6C 3L6.
YouTube / Instagram / LinkedIn / Facebook / X
The Toronto Stock Exchange has neither reviewed nor accepts responsibility for the adequacy or accuracy of this news release.
NOTES
* Refer to the “Valentine Gold Project NI 43-101 Technical Report and Feasibility Study, Newfoundland & Labrador, Canada” dated November 30, 2022 and found on the Calibre website at www.calibremining.com and on SEDAR+ at www.sedarplus.ca.
(1) NON-IFRS FINANCIAL MEASURES
Calibre has included certain non-IFRS measures as discussed below. The Company believes that these measures, in addition to conventional measures prepared in accordance with IFRS, provide investors with an improved ability to evaluate the underlying performance of the Company. These non-IFRS measures are intended to provide additional information and should not be considered in isolation or as a substitute for measures of performance prepared in accordance with IFRS. These measures do not have any standardized meaning prescribed under IFRS, and therefore may not be comparable to other issuers.
TCC per Ounce of Gold: TCC include production costs, royalties, production taxes, refinery charges, and transportation charges. Production costs consist of mine site operating costs such as mining, processing, local administrative costs (including stock-based compensation related to mine operations) and current inventory write-downs, if any. Production costs are exclusive of depreciation and depletion, reclamation, capital and exploration costs. TCC are net of by-product silver sales and are divided by gold ounces sold to arrive at a per ounce figure.
AISC per Ounce of Gold: AISC is a performance measure that reflects the total expenditures that are required to produce an ounce of gold from current operations. While there is no standardized meaning of the measure across the industry, the Company’s definition is derived from the definition as set out by the World Gold Council in its guidance dated June 27, 2013, and November 16, 2018, respectively. The World Gold Council is a non-regulatory, non-profit organization established in 1987 whose members include global senior mining companies. The Company believes that this measure is useful to external users in assessing operating performance and the ability to generate free cash flow from operations.
Calibre defines AISC as the sum of TCC, corporate general and administrative expenses (excluding one-time charges), reclamation accretion related to current operations and amortization of asset retirement obligations (“ARO”), sustaining capital (capital required to maintain current operations at existing production levels), lease repayments, and exploration expenditures designed to increase resource confidence at producing mines. AISC excludes capital expenditures for significant improvements at existing operations deemed to be expansionary in nature, exploration and evaluation related to resource growth, rehabilitation accretion not related to current operations, financing costs, debt repayments, and taxes. Total AISC is divided by gold ounces sold to arrive at a per ounce figure
Average Realized Price per Ounce Sold: Average Realized Gold Price Per Ounce Sold is intended to enable management to understand the average realized price of gold sold in each reporting period after removing the impact of non-gold revenues and by-produce credits, which in the Company’s case are not significant, and to enable investors to understand the Company’s financial performance based on the average realized proceeds of selling gold production in the reporting period. Average Realized Gold Price Per Ounce Sold is a common performance measure that does not have any standardized meaning. The most directly comparable measure prepared in accordance with IFRS is revenue from gold sales.
Adjusted Net Earnings: Adjusted Net Earnings and Adjusted Net Earnings Per Share - Basic exclude a number of temporary or one-time items considered exceptional in nature and not related to the Company’s core operation of mining assets or reflective of recurring operating performance. Management believes Adjusted Net Earnings may assist investors and analysts to better understand the current and future operating performance of the Company’s core mining business. Adjusted Net Earnings and Adjusted Net Earnings Per Share do not have a standard meaning under IFRS. They should not be considered in isolation, or as a substitute for measures of performance prepared in accordance with IFRS and are not necessarily indicative of earnings from mine operations, earnings, or cash flow from operations as determined under IFRS.
Cash From Operating Activities Before Changes in Working Capital: Cash from Operating Activities before Changes in Working Capital is a non-IFRS measure with no standard meaning under IFRS, which is calculated by the Company as net cash from operating activities less working capital items. The Company believes that Net Cash from Operating Activities before Changes in Working Capital, which excludes these non-cash items, provides investors with the ability to better evaluate the operating cash flow performance of the Company.
Net Debt and Adjusted Net Debt: The Company believes that in addition to conventional measures prepared in accordance with IFRS, the Company and certain investors and analysts use net debt to evaluate the Company’s performance. Net debt does not have any standardized meaning prescribed under IFRS, and therefore it may not be comparable to similar measures employed by other companies. This measure is intended to provide additional information and should not be considered in isolation or as a substitute for measures of performances prepared in accordance with IFRS. Net debt is calculated as the sum of the current and non-current portions of loans and borrowings, net of the cash and cash equivalent balance as at the balance sheet date. Adjusted Net Debt is calculated as Net Debt less fair value and other non-cash adjustments that will not result in a cash outflow to the Company. The Company believes that Adjusted Net Debt provides a better understanding of the Company’s liquidity.
EBITDA and Adjusted EBITDA: The Company believes that certain investors use the EBITDA and the adjusted EBITDA (“Adjusted EBITDA”) measures to evaluate the Company’s performance and ability to generate operating cash flows to service debt and fund capital expenditures. EBITDA and Adjusted EBITDA do not have a standardized meaning as prescribed under IFRS and should not be considered in isolation or as a substitute for measures of performance prepared in accordance with IFRS. The Company calculates EBITDA as earnings or loss before taxes for the period excluding depreciation and depletion and finance costs. EBITDA excludes the impact of cash costs of financing activities and taxes and the effects of changes in working capital balances and therefore is not necessarily indicative of operating profit or cash flow from operations as determined under IFRS. Adjusted EBITDA is calculated by excluding one-off costs or credits relating to non-routine transactions from EBITDA that are not indicative of recurring operating performance. Management believes this additional information is useful to investors in understanding the Company’s ability to generate operating cash flow by excluding from the calculation these non-cash and cash amounts that are not indicative of the recurring performance of the underlying operations for the reporting periods.
Adjusted Net Debt to Adjusted EBITDA: The Adjusted Net Debt to Adjusted EBITDA measures provide investors and analysts with additional transparency about the Company’s liquidity position, specifically, the Company’s ability to generate sufficient operating cash flows to meet its mandatory interest obligations and pay down its outstanding debt balance in full at maturity. This measure is a Non-IFRS measure and it is intended to provide additional information and should not be considered in isolation or as a substitute for measures of performance prepared in accordance with IFRS. The calculation of Adjusted Net Debt is shown above.
TCC and AISC per Ounce of Gold Sold Reconciliations
The tables below reconcile TCC and AISC for the three months ended March 31, 2025, December 31, 2024, and March 31, 2024:
| Q1 2025 | |||||||||||
| (in thousands - except per ounce amounts) | Nicaragua | Nevada | Corporate | Consolidated | |||||||
| Production costs | $ | 70,669 | $ | 10,900 | $ | - | $ | 81,569 | |||
| Less: silver by-product revenue | (2,595 | ) | (0 | ) | - | (2,595 | ) | ||||
| Royalties and production taxes | 7,578 | 805 | - | 8,383 | |||||||
| Total cash costs | $ | 75,652 | $ | 11,705 | $ | - | $ | 87,357 | |||
Corporate and general administration | - | - | 6,073 | 6,093 | |||||||
| Reclamation accretion and amortization of ARO | 730 | 525 | - | 1,255 | |||||||
| Sustaining capital(1) | 4,465 | 140 | - | 4,605 | |||||||
| Sustaining exploration | 82 | - | - | 82 | |||||||
| Total AISC | $ | 80,930 | $ | 12,370 | $ | 6,073 | $ | 99,372 | |||
| Gold ounces sold | 64,469 | 7,076 | - | 71,545 | |||||||
| Total Cash Costs | $ | 1,173 | $ | 1,654 | $ | - | $ | 1,221 | |||
| AISC | $ | 1,255 | $ | 1,748 | $ | - | $ | 1,389 | |||
1. Sustaining capital expenditures are shown in the Growth and Sustaining Capital table in the Q1 2025 MD&A.
| Q4 2024 | |||||||||||
| (in thousands - except per ounce amounts) | Nicaragua | Nevada | Corporate | Consolidated | |||||||
| Production costs | $ | 77,823 | $ | 13,325 | $ | - | $ | 91,148 | |||
| Less: silver by-product revenue | (3,465 | ) | (28 | ) | - | (3,493 | ) | ||||
| Royalties and production taxes | 5,924 | 1,211 | - | 7,135 | |||||||
| Total cash costs | $ | 80,282 | $ | 14,508 | $ | - | $ | 94,790 | |||
Corporate and general administration | - | - | 5,394 | 5,394 | |||||||
| Reclamation accretion and amortization of ARO | 1,093 | 148 | - | 1,241 | |||||||
| Sustaining capital(1) | 6,634 | 306 | - | 6,940 | |||||||
| Sustaining exploration | 167 | - | - | 167 | |||||||
| Total AISC | $ | 88,176 | $ | 14,962 | $ | 5,394 | $ | 108,532 | |||
| Gold ounces sold | 66,578 | 9,674 | - | 76,252 | ||||
Total Cash Costs | $ | 1,206 | $ | 1,500 | $ | - | $ | 1,243 |
| AISC | $ | 1,324 | $ | 1,547 | $ | - | $ | 1,423 |
1. Sustaining capital expenditures are shown in the Growth and Sustaining Capital table in the Q1 2025 MD&A.
| Q1 2024 | |||||||||||
| (in thousands - except per ounce amounts) | Nicaragua | Nevada | Corporate | Consolidated | |||||||
| Production costs | $ | 70,501 | $ | 9,646 | $ | - | $ | 80,147 | |||
| Less: silver by-product revenue | (2,671 | ) | (7 | ) | - | (2,678 | ) | ||||
| Royalties and production taxes | 4,193 | 560 | - | 4,753 | |||||||
| Refinery, transportation and other | 366 | 37 | - | 403 | |||||||
| Total cash costs | $ | 72,389 | $ | 10,236 | $ | - | $ | 82,625 | |||
Corporate and general administration | - | - | 4,525 | 4,525 | |||||||
| Reclamation accretion and amortization of ARO | 1,094 | 137 | - | 1,231 | |||||||
| Sustaining capital(1) | 7,411 | 297 | - | 7,708 | |||||||
| Total AISC | $ | 80,894 | $ | 10,670 | $ | 4,525 | $ | 96,089 | |||
| Gold ounces sold | 55,007 | 6,771 | - | 61,778 | |||||||
Total Cash Costs | $ | 1,316 | $ | 1,512 | $ | - | $ | 1,337 | |||
| AISC | $ | 1,471 | $ | 1,576 | $ | - | $ | 1,555 | |||
- Sustaining capital expenditures are shown in the Growth and Sustaining Capital table in the Q1 2025 MD&A.
(2) AVERAGE REALIZED GOLD PRICE PER OUNCE SOLD
The following table provides a reconciliation of Average Realized Gold Price Per Ounce Sold to gold revenue per the consolidated statement of operations and comprehensive income for the reporting periods:
| Three Months Ended | ||||||
| March 31, 2025 | December 31, 2024 | March 31, 2024 | ||||
| Gold revenue (in thousands) | $ | 200,027 | $ | 199,473 | $ | 129,210 |
| Ounces of gold sold | 71,545 | 76,252 | 61,778 | |||
| Average realized price per ounce sold (1) | $ | 2,796 | $ | 2,616 | $ | 2,092 |
- Average realized gold price per ounce sold includes 6,900 ounces in Q1 2025 (6,900 ounces in Q4, 2024 and nil ounces in Q1 2024) at $2,239 per ounce as delivered in accordance with the Prepay I Agreement.
(3) ADJUSTED NET EARNINGS
The following table provides a reconciliation of Adjusted Net Earnings and Adjusted Net Earnings Per Share to the consolidated statement of operations and comprehensive income for the reporting periods:
| Three Months Ended | ||||||||
| (in thousands – except per share) | March 31, 2025 | December 31, 2024 | March 31, 2024 | |||||
| Net earnings | $ | 22,599 | $ | 16,661 | $ | (3,636 | ) | |
| Adjusting items: | ||||||||
| Foreign exchange | (378 | ) | 16,516 | - | ||||
| Loss on financial instruments | 10,108 | 115 | - | |||||
| Project assessment costs | 6,299 | 885 | 8,933 | |||||
| Nicaragua one-time expenses | - | 1,209 | - | |||||
| Non-recurring finance expenses | 1,509 | - | - | |||||
| Mineral property write-off | - | 3,164 | 290 | |||||
| Adjusted net earnings | $ | 40,137 | $ | 38,550 | $ | 5,587 | ||
| Weighted average number of shares outstanding | 848,747 | 838,038 | 653,855 | |||||
| Adjusted net earnings per share - basic | $ | 0.05 | $ | 0.05 | $ | 0.01 | ||
- Adjusted from net earnings to derive Adjusted Net Earnings are one-time transaction costs primarily related to the Equinox Transaction and the acquisition of Marathon, foreign exchange impacts resulting from the translation of the Sprott Loan from US dollars to Canadian dollars, which is the functional currency of Marathon and the non-cash change in fair value of the Company’s gold derivative contracts. Notes Warrants and the derivative conversion option in the CAD Convertible Notes. See Note 18 in the Company’s Q1 2025 Financial Statements.
(4) CASH FROM OPERATING ACTIVITIES BEFORE CHANGES IN WORKING CAPITAL
The following table provides a reconciliation of Cash from Operating Activities before Changes in Working Capital to the consolidated statement of cash flows for the reporting periods:
| Three Months Ended | |||||||||||||
| (in thousands) | March 31, 2025 | December 31 2024 | March 31, 2024 | ||||||||||
| Net cash provided by operating activities | $ | 53,476 | $ | 91,404 | $ | 45,815 | |||||||
| Working capital adjustments | (1,599 | ) | (36,183 | ) | (17,047 | ) | |||||||
| Cash from operating activities before working capital | $ | 55,074 | $ | 127,587 | $ | 62,862 | |||||||
(5) NET DEBT and ADJUSTED NET DEBT
The following table provides a reconciliation of Net Debt and Adjusted Net Debt to the consolidated statement of financial position for the reporting periods:
| (in thousands of dollars) | March 31, 2025 | December 31, 2024 | March 31, 2024 | ||||||
| Current portion of debt | $ | 68,376 | $ | 42,860 | $ | 11,915 | |||
| Non-current portion of debt | 313,801 | 293,556 | 319,032 | ||||||
| Total Debt | $ | 382,177 | $ | 336,416 | $ | 330,947 | |||
| Less: Cash and cash equivalents (unrestricted) | (177,385 | ) | (131,093 | ) | (54,385 | ) | |||
| Net Debt | $ | 204,792 | $ | 205,323 | $ | 276,562 | |||
| Less: Fair value adjustment of Sprott Loan | (40,122 | ) | (40,122 | ) | (35,108 | ) | |||
| Adjusted Net Debt | $ | 164,670 | $ | 165,201 | $ | 241,454 | |||
(6) EBITDA and ADJUSTED EBITDA
The following table provides a reconciliation of EBITDA and Adjusted EBITDA to the consolidated statement of operations and comprehensive income for the reporting periods:
| Three Months Ended | ||||||||
| (in thousands) | March 31, 2025 | December 31, 2024 | March 31, 2024 | |||||
| Earnings before taxes | $ | 46,337 | $ | 34,015 | $ | 7,465 | ||
| Add back: Depreciation and amortization | 33,370 | 40,324 | 17,328 | |||||
| Add back: Finance expense | 3,519 | (883 | ) | 1,686 | ||||
| EBITDA | $ | 83,226 | $ | 73,456 | 26,479 | |||
| Add back: Non-cash and other adjustments | (378 | ) | 16,423 | 1,618 | ||||
| Add back: Net loss on financial instruments | 10,108 | 115 | - | |||||
| Add back: Project assessment costs | 6,299 | 885 | 8,933 | |||||
| Add back: Nicaragua one-time expenses | - | 4,694 | - | |||||
| Add back: Non-recurring finance expenses | 1,509 | - | - | |||||
| Add back: Mineral property write-off | - | - | 290 | |||||
| Adjusted EBITDA | $ | 100,764 | $ | 95,573 | $ | 37,320 | ||
- Adjusted from net earnings to derive adjusted net earnings are one-time transaction costs primarily related to the Equinox Transaction and the acquisition of Marathon, foreign exchange impacts resulting from the translation of the Sprott Loan from US dollars to Canadian dollars, which is the functional currency of Marathon and the non-cash change in fair value of the Company’s gold derivative contracts. Notes Warrants and the derivative conversion option in the CAD Convertible Notes. See Note 18 in the Company’s Q1 2025 Financial Statements.
(7) ADJUSTED NET DEBT TO ADJUSTED EBITDA
The following table provides the reconciliation of Adjusted Net Debt to Adjusted EBITDA using the last twelve months of Adjusted EBITDA for the reporting periods:
| (in thousands of dollars, except ratio) | March 31, 2025 | December 31, 2024 | March 31, 2024 | ||||
| Adjusted Net Debt | $ | 164,670 | $ | 165,201 | $ | 241,454 | |
| Adjusted EBITDA (LTM) | 262,569 | 215,827 | 225,330 | ||||
| Adjusted Net Debt to Adjusted EBITDA (LTM) ratio | 0.63 | 0.77 | 1.07 | ||||
Cautionary Note Regarding Forward Looking Information
This new release contains “forward-looking information” and “forward-looking statements” (collectively “forward-looking statements”) within the meaning of applicable Canadian securities legislation.
Forward-looking statements are statements that are not historical facts and are generally, although not always, identified by words such as “expect”, “plan”, “anticipate”, “project”, “target”, “potential”, “schedule”, “forecast”, “budget”, “estimate”, “assume”, “intend”, “strategy”, “goal”, “objective”, “possible” or “believe” and similar expressions or their negative connotations, or that events or conditions “will”, “would”, “may”, “could”, “should” or “might” occur. All such forward-looking statements are based on the opinions and estimates of management as of the date such statements are made.
Forward-looking statements in this news release include, but are not limited to, the Company’s ability to achieve gold production, cost, development and exploration expectations for its operations and projects; the success and timing of completing construction of the Valentine Gold Mine (“Valentine”), its production and operating capabilities and the upside potential of Valentine; additional exploration success at Valentine; the initial project costs to complete Valentine; the phase two expansion project at Valentine proceeding in accordance with current expectations; the Company’s reinvestment into its existing portfolio of properties for further exploration and growth; statements relating to the Company’s priority resource expansion opportunities; statements regarding expectations for the combined entity ("New Equinox Gold") resulting from the business combination (the “Transaction”) of Calibre and Equinox Gold Corp. (“Equinox”) post-closing; the consummation and timing of the Transaction; the strategic vision for New Equinox Gold following the closing of the Transaction and expectations regarding exploration potential, production capabilities and future financial or operating performance of New Equinox Gold post-closing, including investment returns and share price performance; 2025 production and cost guidance; the potential valuation of New Equinox Gold following the closing of the Transaction; the accuracy of the pro forma financial position and outlook of New Equinox Gold following the closing of the Transaction; the success of the new management team; the conversion of Mineral Resource and Mineral Reserves; the success of Equinox and Calibre in combining operations upon closing of the Transaction; the potential of New Equinox Gold to meet production guidance, industry targets, public profile and expectations; and future plans, projections, objectives, estimates and forecasts and the timing related thereto. Forward-looking statements necessarily involve assumptions, risks and uncertainties, certain of which are beyond Calibre's control. For a listing of risk factors applicable to the Company, please refer to Calibre's annual information form, its audited consolidated financial statements and its management discussion and analysis for the year ended December 31, 2024, and other disclosure documents of the Company filed on the Company’s SEDAR+ profile at www.sedarplus.ca.
Calibre’s forward-looking statements are based on the opinions and estimates of management and reflect their current expectations regarding future events and operating performance and speak only as of the date hereof. Calibre does not assume any obligation to update forward-looking statements if circumstances or management’s beliefs, expectations or opinions should change other than as required by applicable securities laws. There can be no assurance that forward-looking statements will prove to be accurate, and actual results, performance or achievements could differ materially from those expressed in, or implied by, these forward-looking statements. Accordingly, no assurance can be given that any events anticipated by the forward-looking statements will transpire or occur, or if any of them do, what benefits or liabilities Calibre will derive therefrom. For the reasons set forth above, undue reliance should not be placed on forward-looking statements.
Photos accompanying this announcement are available at:
https://www.globenewswire.com/NewsRoom/AttachmentNg/11be9a24-a0c5-41b3-a835-9910d9fd8eb3
https://www.globenewswire.com/NewsRoom/AttachmentNg/1700c5fb-ed4e-41bb-aaa2-d71535fd6fe2

![]()